Imagine you’re trying to make sense of a vast amount of data. You might feel overwhelmed, not knowing where to start or how to interpret all the information. Welcome to the world of statistics, the science of learning from data. As an essential tool in numerous fields such as business, economics, engineering, biology, and social sciences, statistical knowledge is critical for any budding scholar or professional.
Understanding Basic Concepts of Statistics
Statistics is a branch of mathematics that deals with the collection, analysis, interpretation, presentation, and organization of data. It involves understanding and applying complex numerical data, which is often used to make informed decisions.

- Statistical Population and Sample: A statistical population is a set of entities concerning which statistical inferences are to be drawn, often based on a random sample taken from the population. A sample, on the other hand, is a subset of the population and serves as a reflection of the entire group.
- Statistical Variables: These are characteristics or attributes that can assume different values. Variables are categorized into quantitative (numerical) and qualitative (categorical). Quantitative variables are further divided into discrete and continuous variables.
- Central Tendency Measures: These are measures that indicate the center point or typical value of a dataset. The most common measures of central tendency are the mean (average), median (middle value), and mode (most common value).
- Dispersion Measures: These provide insights into the spread of the data. Common measures include range, variance, standard deviation, and interquartile range.
- Statistical Hypothesis Testing: This is a procedure that allows us to choose between two different hypotheses about a population parameter based on a sample. The null hypothesis typically represents a theory that has been put forward, while the alternative hypothesis represents what the test is set up to examine.
Cracking the Code of Probability
Probability is a fundamental concept in statistics. It is a measure of the likelihood that a given event will occur. Events are usually defined in terms of outcomes or defined subsets of a sample space. Probability provides a way to quantify uncertainty and thus plays a crucial role in statistics.

Data Visualization: The Art of Representing Data
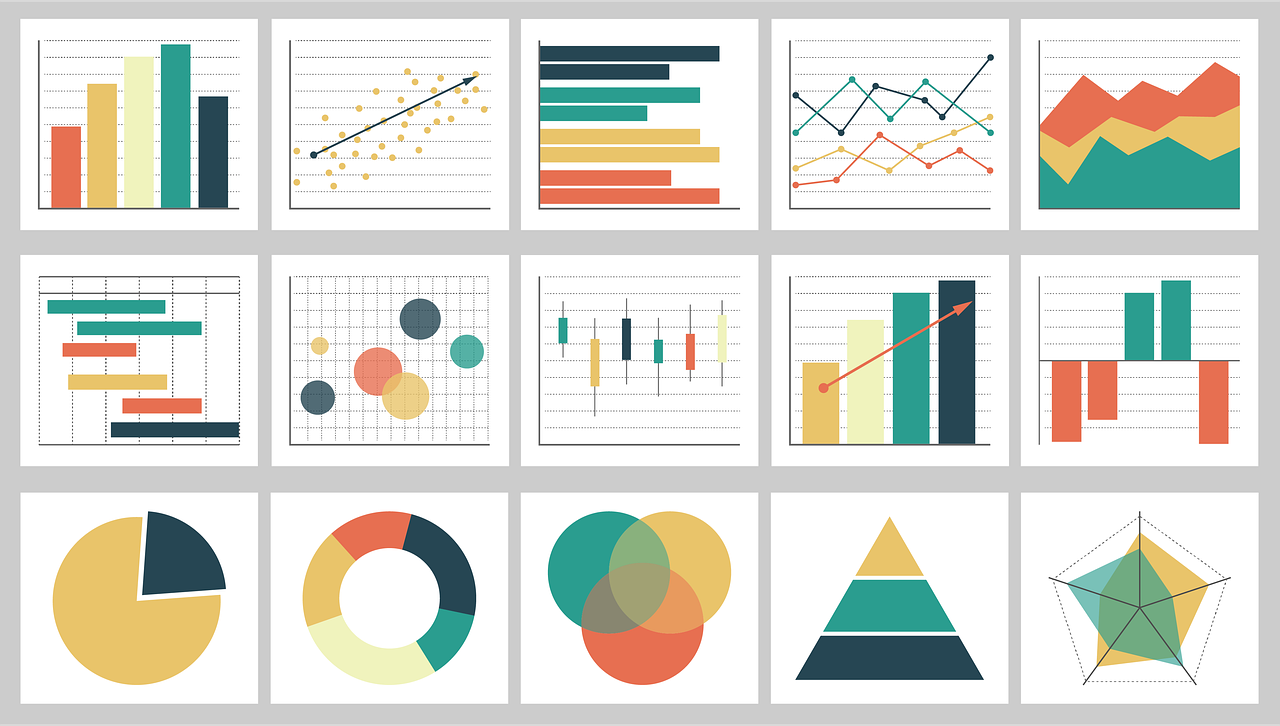
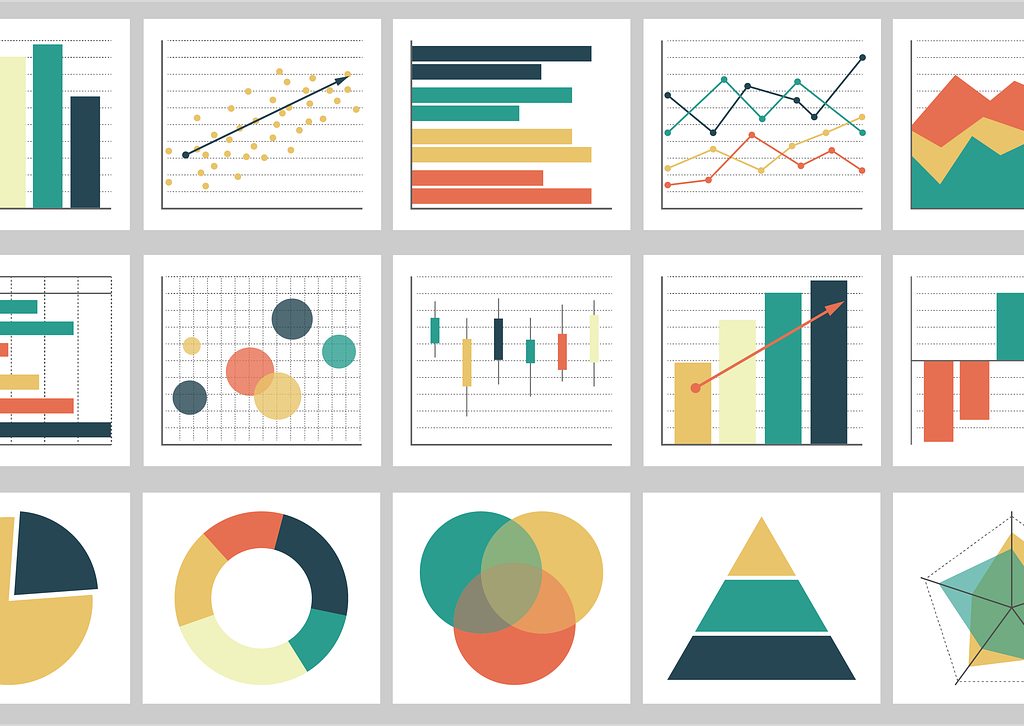
Data visualization is the representation of data or information in a graphical format. It makes complex data more understandable, accessible, and usable. Common forms of data visualization include bar charts, pie charts, histograms, scatter plots, and box-and-whisker plots.
Embracing Advanced Statistical Methods
As you get comfortable with basic statistics, you can start exploring advanced concepts like regression analysis, ANOVA (Analysis of Variance), chi-square tests, t-tests, correlation and causation, and Bayesian statistics, among others.
While statistics may seem daunting at first, understanding its basic concepts can make the subject much more approachable and practical. In an age dominated by data, statistical literacy is not just a requirement for a few; it is a necessary skill for all.